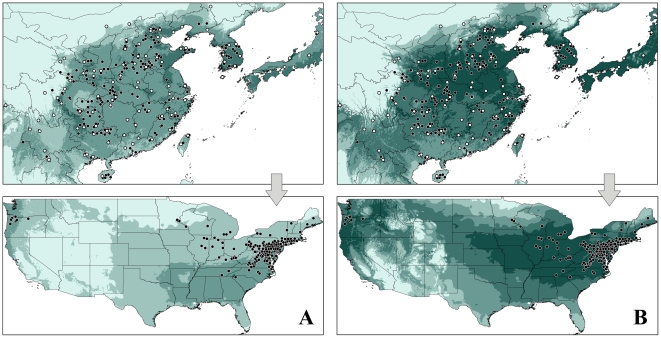
Figure 3. Niche models based on reduced native records and projected onto the US using Maxent.
Dark green color represents high suitability, light green indicates low suitability. A: using 10 variables, B: using 6 variables, white and black dots represent the 95 occurrences for model calibration and the remaining for model evaluation.

