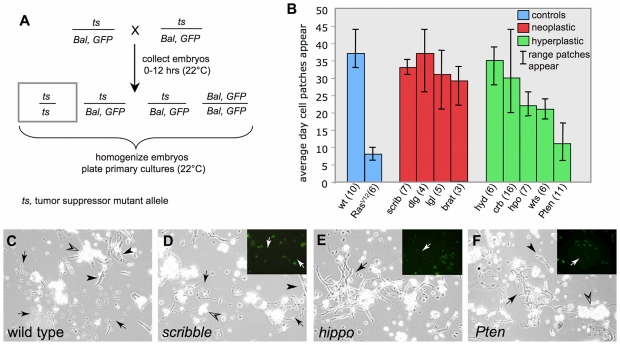
Figure 1. Time of appearance of proliferating cell patches in wild-type and tumor-suppressor mutant primary cultures.
(A) Cross to generate embryos for tumor suppressor primary cultures. Tumor suppressor (ts) mutants were maintained in stocks with a marked balancer chromosome that expresses a GFP transgene (Bal, GFP). One quarter of the progeny embryos are the desired class (boxed genotype). Primary cultures were established from mixed embryos and cells homozygous for the ts allele could be recognized because they are GFP negative. (B) The average day, and the range of days at which proliferating cells appear is shown. The number of cultures for each genotype is given (n). Wild-type control and Act-Gal4; UAS-RasV12 positive control (blue); neoplastic mutants (red); hyperplastic mutants (green). The appearance of proliferating cells in Pten and RasV12 cultures was significantly earlier than in wild-type control cultures (P<0.001). The appearance of proliferating cells in wts and hippo cultures was also significantly earlier than in wild-type control cultures (P<0.05). There were no significant differences between wild-type control cultures and any of the neoplastic mutants. See also Figure S1. (C–F) Examples of cultures showing proliferating patches that first appeared on average at about 33–37 days in wild type (C) and scribble (D), 21 days in hippo (E) and 11 days in Pten (F). Differentiated cell types such as muscle (arrowhead) and fat (open arrowhead) are present in all genotypes. Insets in D–F show a GFP image demonstrating that the indicated patches of proliferating cells (arrows) were negative for GFP and therefore of the mutant genotype.

