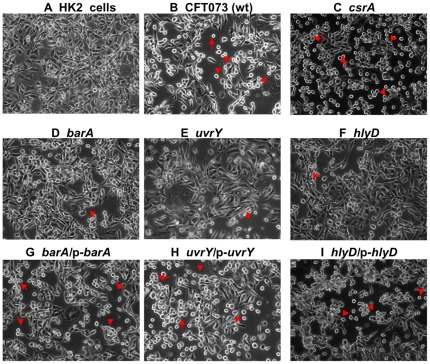
Figure 3. Phase-contrast photomicrographs of human kidney (HK-2) cells.
Photomicrographs were taken 6 hr later from either untreated control (HK-2 cells) (A), or treated with supernatants from CFT073 WT (B), csrA (C), barA (D), uvrY (E), hlyD (F), barA/p-barA (G), uvrY/p-uvrY (H) and hlyD/p-hlyD (I). The rounding and detachment of cells in the treated monolayer are marked with arrow or arrowhead. The pictures were representative of three individual experiments.

