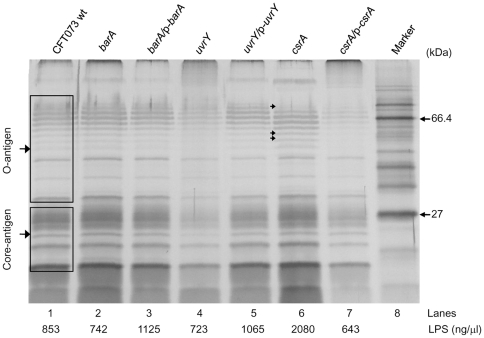
Figure 5. Lipopolysaccharide profiles of wild type and mutant bacteria.
LPS was extracted from equal number of cells and separated on 12% SDS-PAGE gel and visualized with silver stain. The upper bands represent the O antigen and the lower bands represent the core LPS antigen. The results were representative of three individual experiments. Lanes: 1. CFT073 wt, 2. barA, 3. barA/p-barA, 4. uvrY, 5. uvrY/p-uvrY, 6. csrA, 7. csrA/p-csrA, 8. protein marker.

