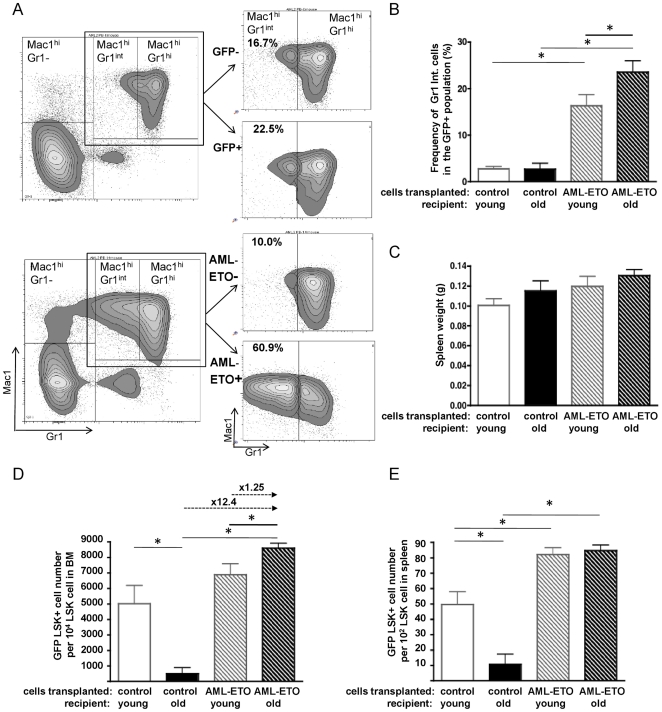
Figure 2. Elevated immature myeloid cell load and expansion of myeloproliferation-initiating stem cells in an aged microenvironment.
(A) Representative FACS profiles of PB from an aged control-transplanted (upper panel) and an aged AML-ETO-transplanted (lower panel) recipient at 25 weeks post transplantation for determination of immature myeloid cells. Immature myeloid cells were identified as Gr1intMac1hi cells whereas Gr1hiMac1hi cells represent mature myeloid cells (right panels: highlighting the Gr1Mac1 double positive population divided into GFP+ and GFP− cell-fraction and Gr1intMac1hi and Gr1hiMac1hi subpopulations). (B) Frequency of immature myeloid cells (Gr1intMac1hi) among GFP+ cells in PB at 24–25 weeks post transplantation. (C) Spleen weight in the recipient animals. (D) Quantitation of flow cytometric analyses of BM derived GFP+LSK cells in recipient animals. The relative increase of GFP+LSK cells among the experimental groups is depicted on top of the arrows. (E) Quantitation of flow cytometric analyses of spleen derived GFP+LSK cells in recipient animals. (Control-cell transplanted in young recipient n = 8, control-cell transplanted in old recipient n = 5, AML-ETO+cell transplanted in young recipient n = 12, AML-ETO+cell transplanted in old recipient n = 11, from a total of 3 independent biological repeats, * = p<0.05). Bars represent the mean ± SEM.

