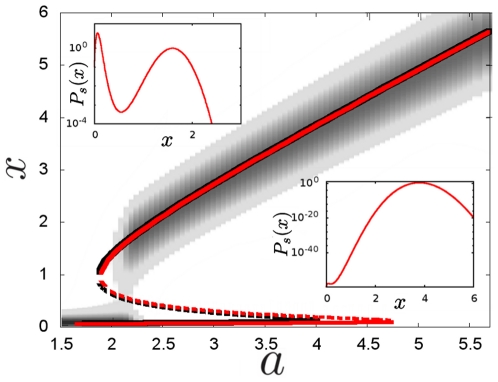
Figure 1. Steady state values do not change significantly when intrinsic noise is included.
Bifurcation diagram for the deterministic model (black) and the multiplicative noise model (red). Stable steady states (continuous lines) and unstable steady states (dashed lines) are minima and maxima, respectively, of the potentials. The bifurcation diagram of a stochastic description with a thermal bath (additive noise) is necessarily the same as the one of the deterministic model. The stationary probability distribution for the multiplicative noise model, Eq (9), for different  values is shown in grey scale. Insets: Stationary probability distributions for the multiplicative noise model for
  (top) and
  (bottom).

