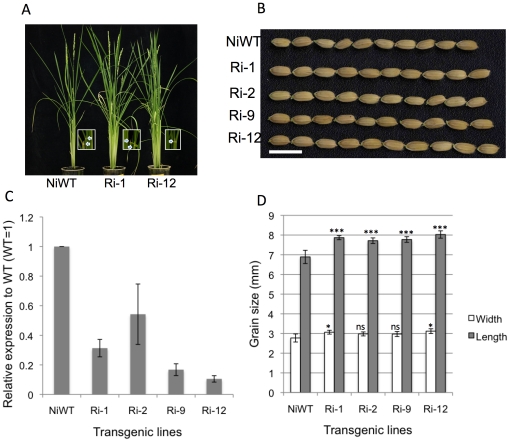
Figure 4. Phenotypes of APG RNAi lines.
A) RNAi lines Ri-1 and Ri-12, and Nipponbare WT. Inset indicates the laminar joint leaf of each line with arrow heads (bar = 10 cm). B) Grain phenotype of representative transgenic T0 (bar = 1 cm). C) Quantitative PCR expression analysis of APG in lemma/palea of T0 plants (WT = 1) normalized by OsActin. The error bar indicates ±sd over three biological repeats. D) Comparison of grain length and width of transgenic T0 and wild type plant (error bar ±sd, n = 15). Asterisks denote a significant difference from the wild type as determined by Student's t tests (ns, not significant; *, p<0.05; ***,p<0.001).

