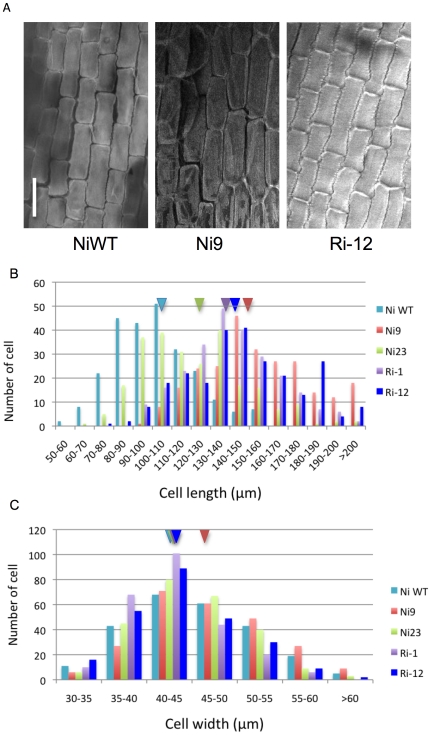
Figure 5. Inner epidermal cells observed by confocal microscopy.
A) Lemma inner epidermal cells of NiWT and transgenic PGL1:OX (Ni9) and APG RNAi (Ri-12) (bar = 100 µm). B) Distribution of the number of cells at various cell lengths. C) Distribution of the number of cells at various cell widths; NiWT, Nippobare wild type cyan; T0 transgenic PGL1:OX line Ni9, red; Ni23 green; RNAi T0 line Ri-1, purple; and Ri-12, blue. Triangles represent average values of the respective lines.

