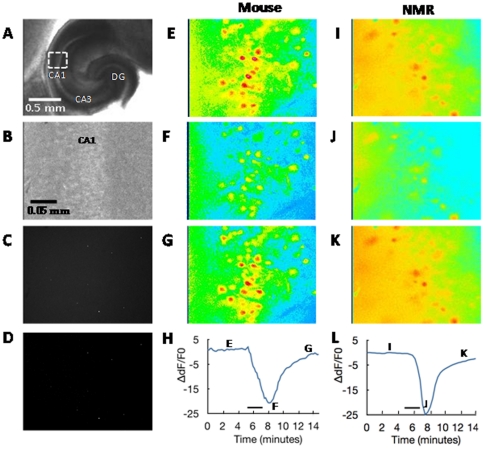
Figure 1. Images of hippocampal slices.
A. Low magnification, bright field image of a slice with a box indicating the typical target area for imaging within the CA1 field of the hippocampus. DG = dentate gyrus. Top is posterior. B. High magnification, bright field image of a slice of the CA1 region. C. Same slice as shown in B, exposed to 365 nm wavelength, this slice was not loaded with fura-2 and the image reflects a 10 second integration time. D. Same slice as B and C, exposed to 365 nm wavelength, again not loaded with fura-2. The image reflects a 1 second integration time during exposure to hypoxia. E–G. Representative data from a P6 mouse slice tested with 25 mM potassium. Images show CA1 cells loaded with fura-2 before, during, and after application of 25 mM potassium for 2 minutes. The decrease in fluorescence in F corresponds to an increase in internal calcium due to application of potassium. These representative images are at 380 nm wavelength (not ratiometric). H. Curve showing the ratiometric data for the slice in E–G over 15 minutes. For this example, 4 minutes of data are shown prior to switching the bath solution to 25 mM potassium to illustrate the stability of typical baseline responses. For all group analyses, we collected data for 1 minute prior to switching solutions. The black bar indicates when the 25 mM solution was in the recording chamber (there was about a 1 minute time lag after switching solutions due to travel time to the recording chamber). I–L. An example of the same procedures on a P6 naked mole-rat.

