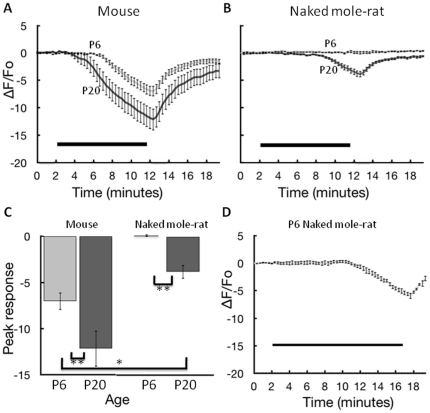
Figure 2. Increase in internal calcium from exposure to hypoxic bath solution.
A. Data from P6 (11 slices, 6 animals) and P20 (11 slices, 6 animals) mouse hippocampal slices. Values on the y-axis indicate the percent change in calcium-mediated fluorescence within CA1 neurons in the field of interest with negative values corresponding to an increase in calcium (calcium decreases the fluorescent signal). Images were collected every 20 seconds over 20 minutes. The black bar indicates the 10 minutes when hypoxic bath solution was in the recording chamber. Error bars are +/− S.E.M. B. Data from P6 (14 slices, 5 animals) and P20 (10 slices, 3 animals) naked mole-rat slices. C. Summary data showing the change in maximal calcium with age for mice and naked mole-rats for a 10-minute exposure. * and ** correspond to significance at p<0.05 and p<.01, respectively according to the Newman-Keuls test. D. Data from P6 (7 slices, 2 animals) naked mole-rats slices with an extended hypoxia exposure (15 minutes). Note that in all panels, animals in the P6 groups actually ranged in age from P5 to P7, and animals in the P20 groups actually ranged in age from P18 to P22.

