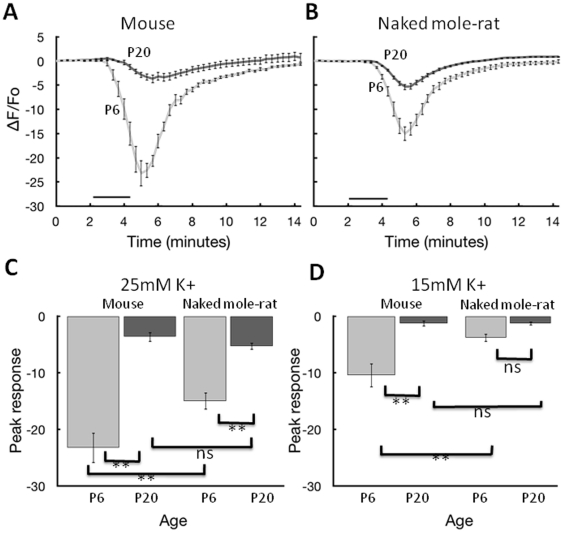
Figure 3. Increase in internal calcium from exposure to high K+ bath solutions.
A. Data from P6 (9 slices, 4 animals) and P20 (8 slices, 5 animals) mouse hippocampal slices. Images were collected over 15 minutes. The black bars indicate the 2 minute time course that 25 mM potassium bath solution was applied. B. Data from P6 (10 slices, 4 animals) and P20 (15 slices, 4 animals) naked mole-rat slices tested under the same conditions as A. C. Summary data showing the change in maximal calcium with age for P6 and P20 mice and naked mole-rats during the 2 minute exposure to 25 mM K+. D. Summary data showing the change in maximal calcium with age for P6 and P20 mice and naked mole-rats during a 2 minute exposure to 15 mM K+. * and ** correspond to significance at p<0.05 and p<.01, respectively according to the Newman-Keuls test.

