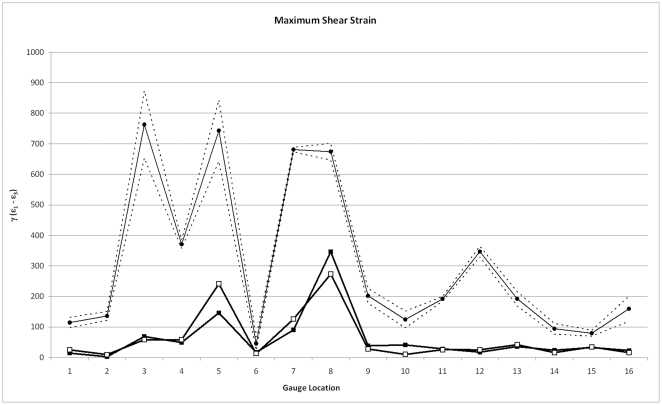
Figure 5. Comparisons of shear strain.
Comparisons of shear strain (γmax = εmax−εmin) in models without (black squares) and with (white squares) sutures, with experimental data (black circles). Dashed lines show 2 standard errors of the experimental mean. Gauges 1 and 6 gave unstable experimental results and should be disregarded.

