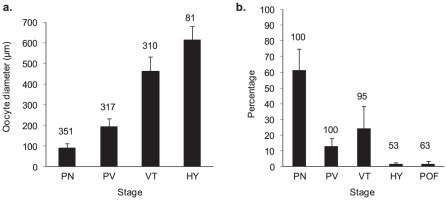
Figure 3. Size and relative frequency of black marlin oocyte stages.
A - Mean sizes of oocyte development stages (+ 1SD) pooled from 19 black marlin taken from the Ribbon Reefs. The numbers above the bars indicate the number of oocytes measured. B – The mean proportional distribution of the various oocyte development stages in a fish (+ 1SD) compiled from 9312 egg counts. The numbers above the bars indicate the percentage of fish with each of the development stages. Stage designations are translated in Figure 2.

