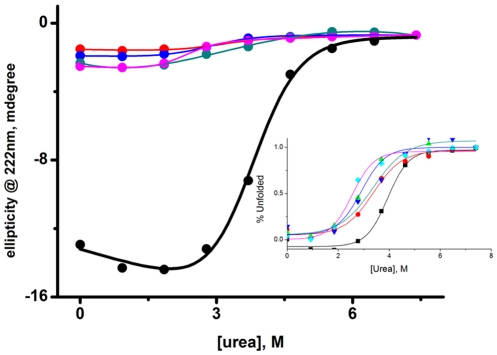
Figure 6. Unfolding transitions of WT and cysteine mutants of Viperin monitored by far- UV CD.
Urea induced unfolding of the WT (black), the triple mutant (red), C83A mutant (blue), C87A mutant (dark green), and C90A mutant (magenta) of Viperin. The ellipticity measured at 223 nm is plotted against urea concentration. The data for WT and the cysteine mutants are fit to equation 1 assuming two state unfolding transitions. The experiments have been carried out in 20 mM phosphate buffer at pH 7.5.

