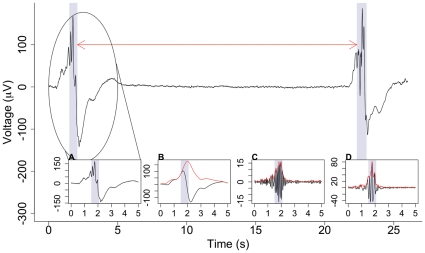
Figure 1. Example of nested activity detected within large depolarisations.
EEG data recorded from subject 5, C4-O2. The shaded areas show detected events and the arrow indicates the inter-event interval. These events are detected from the co-occurrence of slow wave and high frequency activity. The insets show the circled signal (A), low-pass filtered at 2 Hz (B), band-pass filtered at 8–22 Hz (C) and with slow waves removed (D) along with the corresponding absolute value of the Hilbert transforms (red).

