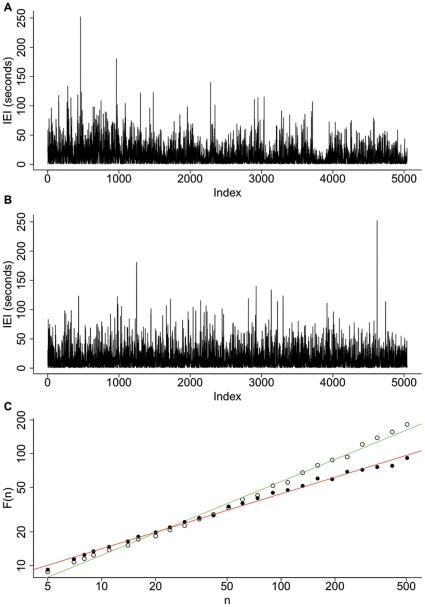
Figure 2. Inter-event interval (IEI) sequence and detrended fluctuation analysis (DFA) estimates.
(A) An example of an IEI sequence – produced from the sequential ordering of IEI. This sequence is from the C3-O1 bipolar recording of subject 5. Index indicates the sequential order of the IEI. (B) An example of a randomly shuffled sequence for the data set shown in (A). (C) DFA plot for both sequences with window size, n, against root mean square fluctuation, F(n), open circles - DFA of the actual IEI sequence, filled circles - DFA of the shuffled sequence shown in (B). DFA was calculated with a maximum window size of 1/10 of the length of the sequence. For each the line of best fit is shown (green for the actual IEI sequence, red for the shuffled sequence). The Hurst exponent is estimated by the slope of the line of best fit which in these cases were H = 0.66 and H = 0.49 for the IEI and shuffled sequences respectively.

