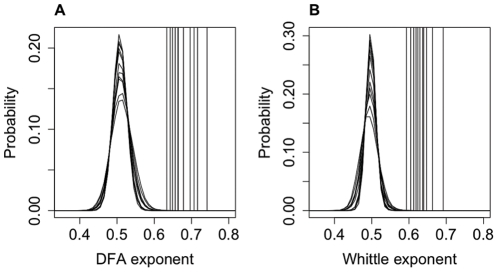
Figure 3. Comparison of the DFA and Whittle exponents with the shuffled data.
The DFA (A) and Whittle (B) exponents for each subject (vertical lines, averaged across channels) are clearly distinct from the pooled probability distributions of exponents formed from 5000 shuffled sequences. The exponents from the IEI sequences were found to be significantly different from the shuffled distributions (P<0.001) using the one sample Wilcoxon signed rank test, indicating LRTCs in the IEI sequences of all subjects studied. The data is plotted here using the same format as Figure 4 [10].

