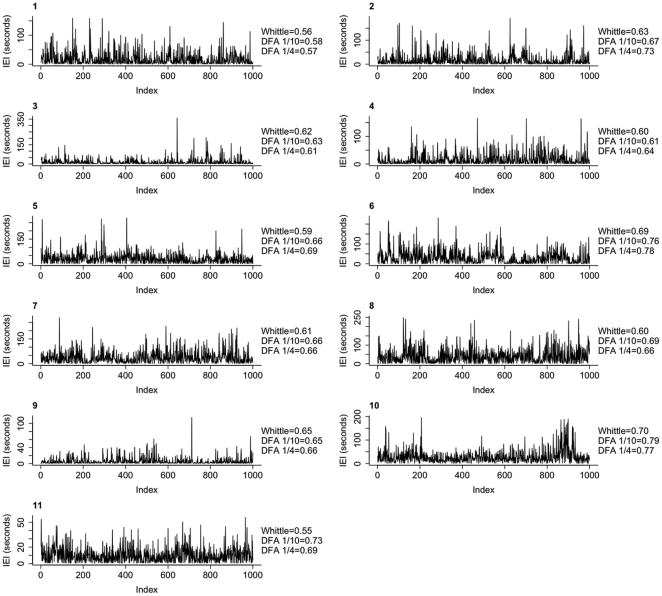
Figure 5. Examples of inter-event interval (IEI) sequences from each of the 11 subjects.
Each sequence consists of the first 1000 IEIs from the recording at F4-C4 for each subject (1–11). The corresponding Whittle and DFA exponents for these fixed length sequences are indicated. DFA 1/10 is the exponent calculated with a maximum window size of 1/10 of the length of the data (which in this case is always 100 IEIs). DFA 1/4 is the exponent calculated with a maximum window size of 1/4 of the length of the data (which in this case is always 250 IEIs).

