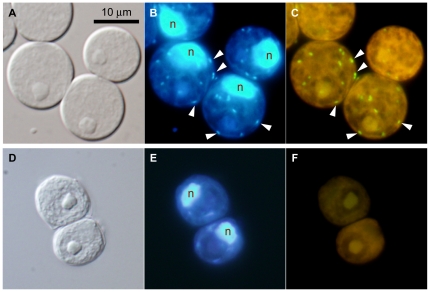
Figure 3. FISH identification of rickettsiacean endosymbionts in Carteria cerasiformis cells.
A–C. C. cerasiformis NIES-425. D–F. C. cerasiformis NIES-424. Horizontal panels show the same cells, composed of Nomarski differential interference images (A, D), epifluorescence images with DAPI staining (B, E) and epifluorescence images with the volv-835 probe specific for the endosymbiont of C. cerasiformis NIES-425 (C, F; for details, see Materials and Methods). Arrowheads point to the signals from the endosymbionts. The green signals (C) represent endosymbiont-specific probes and the yellow background (C, F) is autofluorescence. All are shown at the same magnification. The ‘n’ indicates host cell nuclei.

