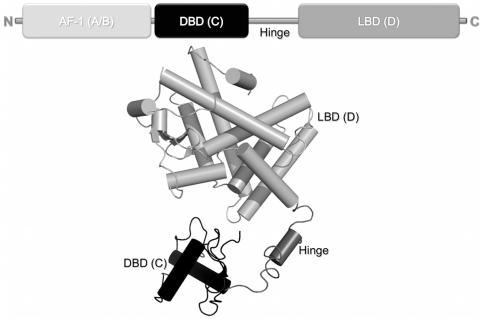
Figure 1. Structural organization of nuclear receptors functional domains.
A) Bar representation of nuclear receptors domains. B) Cartoon of crystallographic structure of intact PPARγ+RXRα+DR-1 complex (PDB 3DZU). The N-terminal region (A/B) represented by a light gray bar is absent in the structure because of it high flexibility. The conserved C region, which corresponds to the DBD, is given in black; the LBD, or region E, is shown in gray; and located between C and E domains, the hinge given here in dark gray.

