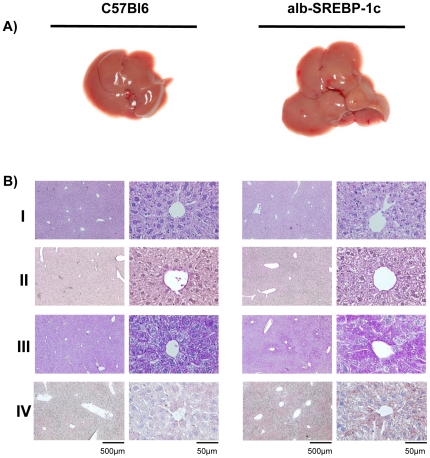
Figure 2. Macroscopic and histological comparison of livers from C57Bl6 and alb-SREBP-1c mice.
Panel (A) shows fatty liver macroscopically of a C57Bl6 (left) or alb-SREBP-1c (right) mouse. (B) Liver tissue of the Lobus caudatus, Lobus sinister- and Lobus dexter lateralis were used for (I) standard hematoxylin and eosin staining. (II) PAS staining was performed to determine glycogen content. (III) The tissues were also used for cryofixation, and Oil-red-O staining was used for lipid visualization. (IV) Fibers and the extra cellular matrix were visualized to determine tissue integrity. The overview magnification is 1∶10, and details are shown in 1∶100 magnification.

