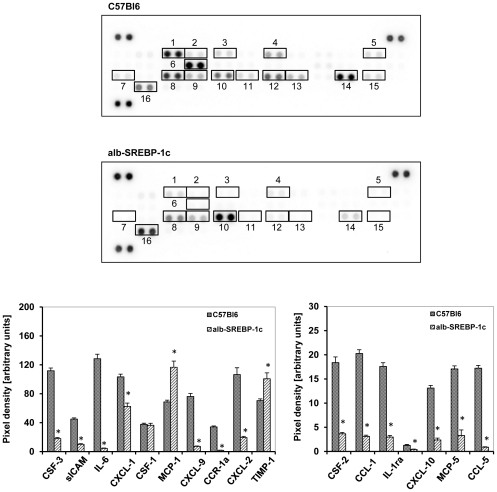
Figure 6. Cytokine profile secreted from isolated adipocytes of C57Bl6 and transgenic alb-SREBP-1c animals.
The cytokine content in supernatant of cultured primary adipocytes was analyzed using the Proteome Profiler™; R&D Systems, (Abingdon, UK). Spot intensities were normalized to background and positive controls set to 100% intensity. Presented numbers on membranes mark targets as follows: (1) CSF-3; (2) CSF-2; (3) CCL-1; (4) sICAM -; (5) IL-1ra; (6) IL-6; (7) CXCL-10; (8) CXCL-1; (9) CSF-1; (10) MCP-1; (11) MCP-5; (12) CXCL-9; (13) CCR-1a; (14) CXCL-2; (15) CCL-5; (16) TIMP-1. Abundance of: CXCL-13, C5a, CCL-11, IFN-γ, IL1-α, IL1-ß, IL-2, IL-3, IL-4, IL-5, IL-7, IL-10, IL-13, IL-12-p70, IL-16, IL-17, IL-23, IL-27, CXCL-11, CCL-4, CXCL-12, CCL-17, TNF-α or TREM-1 was not detected. Data are given as means ± S.D. (n = 6, each) of normalized intensity. Significance was calculated by 2-way ANOVA. C57Bl6 vs. alb-SREBP-1c mice: *p<0.01.

