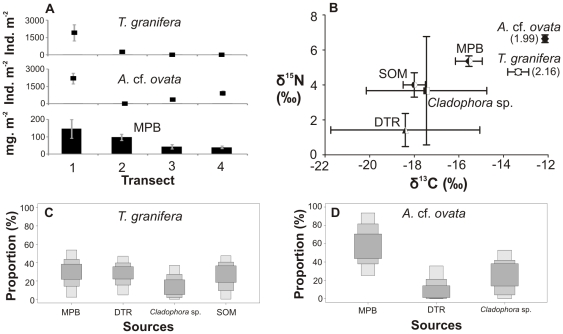
Figure 3. Gastropods, food sources and diets in Catalina Bay, 2009.
(A) Four-point 6 m transect showing gastropod densities and microphytobenthic (MPB) biomass (as chl-a concentration). (B) Carbon and nitrogen stable isotope signatures of gastropods (number in brackets: trophic position) and their potential food sources, such as detritus (DTR) and sedimentary organic matter (SOM). SIAR boxplots show the proportional contribution (%) of different sources to the diet of (C) Tarebia granifera, (D) Assiminea cf. ovata. Samples were collected in a freshwater seepage area of Catalina Bay in October 2009. Salinity ranged from 1 to 10. The water level at South Lake was once again low, thereby allowing the formation of fresh and brackish water ponds along the eastern shores.

