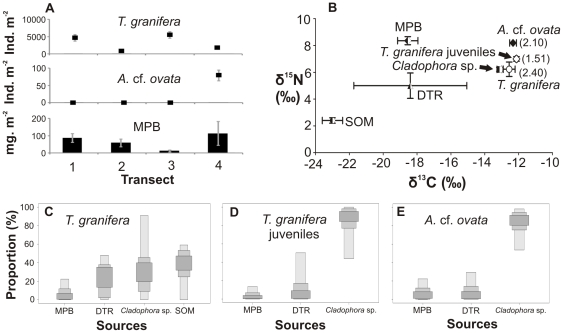
Figure 4. Gastropods, food sources and diets in Catalina Bay, 2010.
(A) Four-point 10 m transect showing gastropod densities and microphytobenthic (MPB) biomass (as chl-a concentration). (B) Carbon and nitrogen stable isotope signatures of gastropods (number in brackets: trophic position) and their potential food sources, such as detritus (DTR) and sedimentary organic matter (SOM). SIAR boxplots show the proportional contribution (%) of different sources to the diet of (C) Tarebia granifera (shell height ≈13 mm), (D) T. granifera juveniles (shell height ≤5 mm) and (E) Assiminea cf. ovata. Samples were collected in a freshwater seepage area of Catalina Bay in February 2010. Salinity was 0.15–0.8. Although the salinity of the South Lake ranged between 47 and 56, its water level continued to decrease and larger freshwater ponds were formed in seepage areas along the eastern shores.

