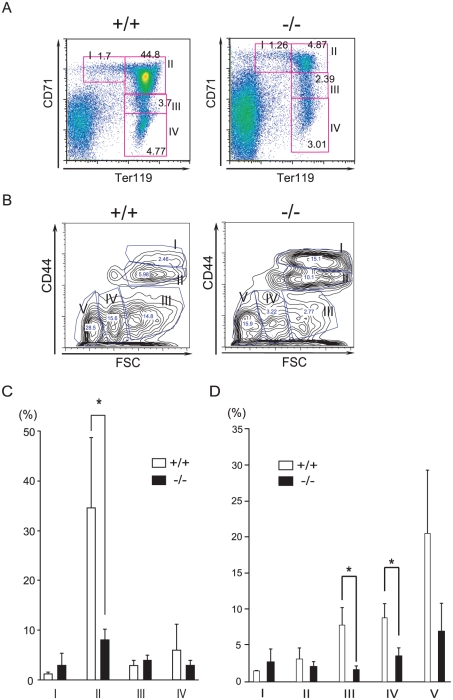
Figure 3. FACS analyses of erythroblasts at different stages of maturation in wild-type or CALM-deficient mice.
(A) Representative flow cytometry histograms. In 3-week-old mice, erythroblasts at different maturation stages were identified by double staining with FITC-conjugated anti-TER119 and PE-conjugated anti-CD71 Abs. (B) Representative flow cytometry histograms. Erythroblasts at different maturation stages were identified by double staining with FITC-conjugated anti-TER119 and APC-conjugated anti-CD44 Abs. Plots of CD44 vs. forward scatter (FSC) for TRE119-positive cells are shown. (C) Quantification of regions I to IV of (A) (data represent means±SD; n = 4). *, P<0.05 vs. control. (D) Quantification of regions I to V of (B) (data represent means±SD; n = 5). *, P<0.05 vs. control.

