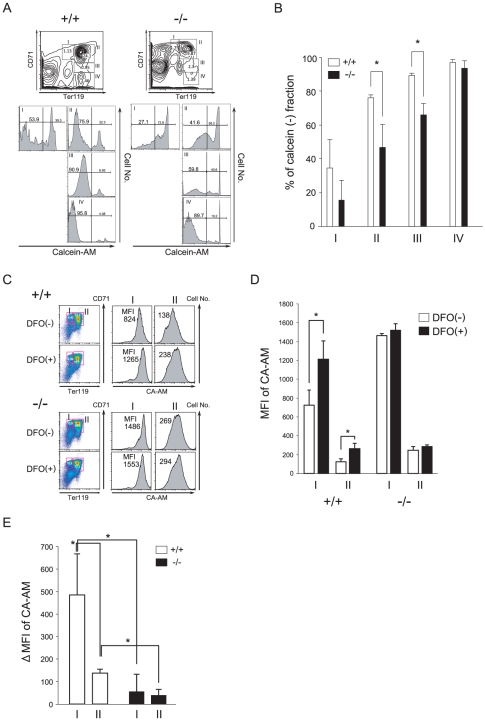
Figure 5. Flow cytometry analysis of the LIP.
(A) Representative flow cytometry histograms. Erythroblasts at different stages of maturation were identified by double staining with APC-conjugated anti-TER119 and PE-conjugated anti-CD71 Abs (upper). These cells were simultaneously loaded with calcein (CA-AM) for the LIP assay (lower). (B) Quantification of CA-negative fractions in regions I to IV of (A) (data represent means±SD; n = 3). (C) Representative flow cytometry histograms of E14.5 fetal liver cells. Erythroblasts at different stages of maturation were identified by double staining with APC-conjugated anti-TER119 and PE-conjugated anti-CD71 Abs. Cells were treated for 1 h with the iron chelator DFO, loaded with CA-AM for 10 min, and then analyzed. (D) Representative fluorescence (FL1-high) histograms of CA-stained cells treated with or without DFO are shown, along with mean fluorescence intensity (MFI). (E) The LIP is represented by the difference in MFI between DFO-treated and -untreated cells (data represent means±SD; n = 3). *, P<0.05 vs. control. In A, B, C and D, (+/+) and (−/−) represent wild-type and CALM-deficient mice, respectively.

