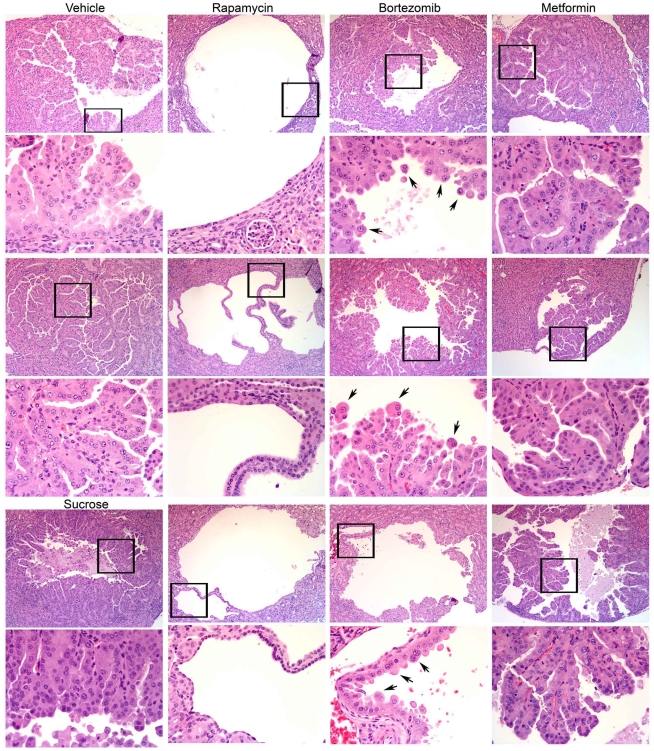
Figure 2. Renal cystadenoma histology in the treated mice.
Representative tumor images are shown for each treatment cohort, selected from the kidneys with the largest tumor volume for each. Three cystadenoma each are shown at 100×, with a portion of the tumor indicated by the frame shown at 400× (below). Cystadenomas from control mice are shown in the first column, two from IP vehicle treated mice, and one from a sucrose treated mouse. Note the cystic nature of the tumors from the rapamycin-treated mice, as well as the flattened, thin nature of the cyst-lining cells, in contrast to cystadenomas from all other mice. Arrows point to prominent enlarged but viable cells in the bortezomib-treated mice.

