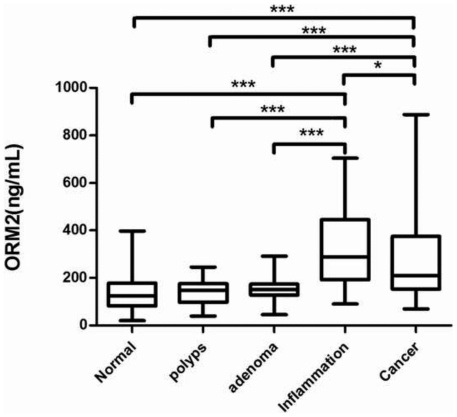
Figure 1. Serum ORM2 levels on a log scale in box-and-whisker plots.
The star (stars) in the figure means a sign for statistical analysis. One star means P<0.05 and the sign with three stars mean P<0.001. CRC is statistically different from the normal colorectum, hyperplastic polyp and adenoma (all at P<0.001, respectively); IBD is statistically different from normal the colorectum hyperplastic polyp and adenoma (all at P<0.001, respectively). IBD is statistically different from colorectal cancer (P<0.05).

