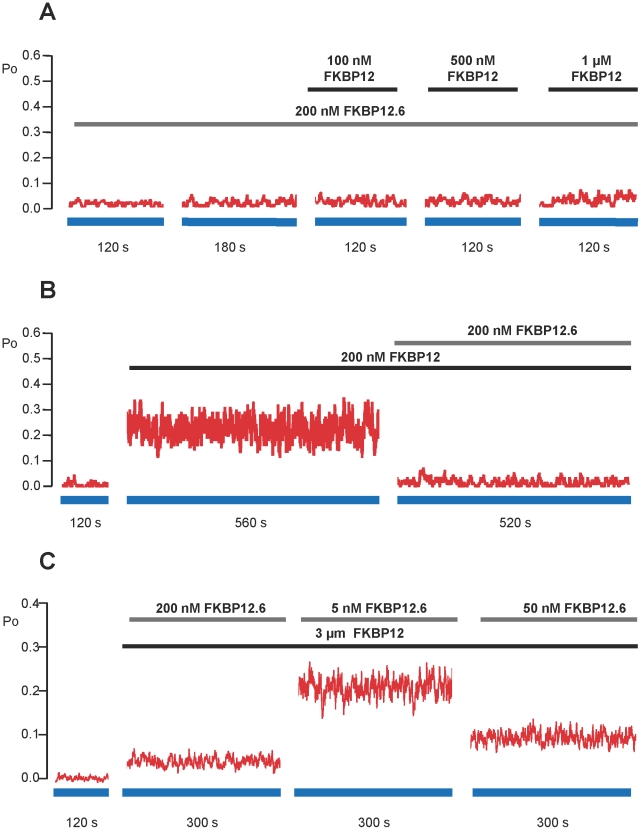
Figure 7. Model predictions of RyR2 Po at equilibrium in the presence of both FKBP12 and FKBP12.6.
Model predictions of RyR2 equilibrium Po for the combinations of FKBP12 and FKBP12.6 that are present in the experiments detailed in Figure 4. Panels A and B show the predicted Po at equilibrium of a typical RyR2 channel under the experimental conditions shown in Figures 4A and 4B, respectively. Whereas the single-channel experiments (Figure 4) which, on average, run for approximately 20 min, typically reflect the effects of the protein that bound first (since dissociation rates of FKBP12 and 12.6 are so slow), the model allows us to predict what would happen at equilibrium. (C) Model predictions of equilibrium RyR2 Po if FKBP12.6 levels vary while FKBP12 is maintained at a physiological level of 3 µM. Steady-state Po values at equilibrium have been computed by taking a trial average over 100 Monte Carlo simulations of a single RyR2 channel. The parameter values used in the simulations are given in Table 1.

