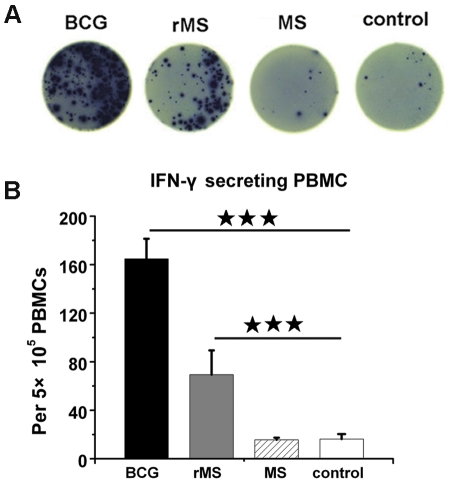
Figure 6. Detection of IFN-γ producing splenocytes by ELISPOT.
(A) Photographs of representative wells. (B) Bars representing the mean ± SEM of SFUs. A significant difference was found between the IFN-γ secretion from splenocytes of the rMS group and the BCG group and that from the saline group. No significant difference was found between the saline group and the M. smegmatis group.

