
Fig. 2.
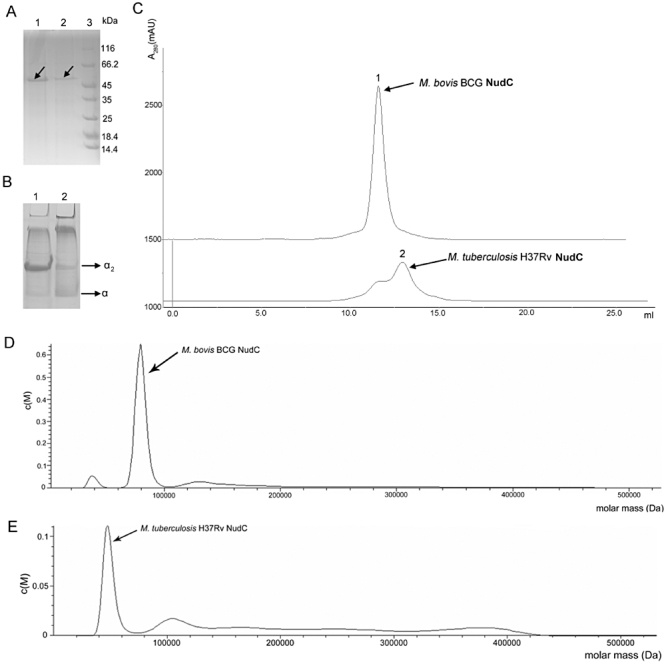
Analysis of NudC native structure.
A. Nickel affinity-purified NudCBCG (lane 1, arrow) and NudCRv (lane 2, arrow) were electrophoresed on 10% (v/v) SDS-PAGE; lane 3: protein molecular weight marker.
B. Native PAGE of purified NudCBCG (lane 1) and NudCRv (lane 2) on 9% (v/v) PAGE. Two NudC bands were detected and are indicated as α2 and α (arrows indicated).
C. Gel exclusion chromatography analysis of the native structure of purified NudCRv and NudCBCG. Nickel affinity-purified NudCBCG and NudCRv were concentrated then loaded onto a Superdex 200 10/300GL column and eluted.
D and E. Analytical ultracentrifugation analysis of the native structure of purified NudCBCG (D) and NudCRv (E). Expected products are indicated by arrows.