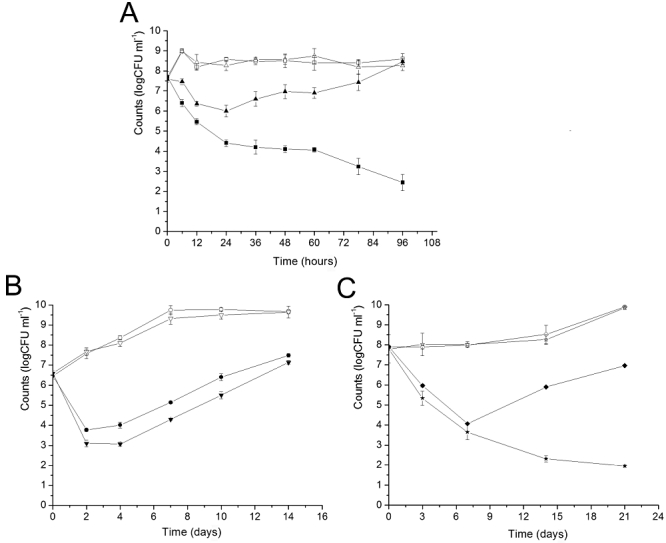
Fig. 4.

INH and ETH mycobacterial killing curves. Mycobacterial cells were grown to mid-log phase (OD600 of 0.5–1.0) and diluted to about 106–107 cfu ml−1 in fresh medium. INH or ETH was then added and aliquots were removed at regular intervals. Serial dilutions were performed before plating.
A. M. smegmatis mc2155 (▵) and mc2155 ΔnudC (□) with no drug added; M. smegmatis mc2155 (▴) and mc2155 ΔnudC ( ) with 50 µg ml−1 INH added.
B. M. bovis BCG (○) and BCG ΔnudC (▿) with no drug added; M. bovis BCG (•) and BCG ΔnudC (▾) with 5 µg ml−1 INH added.
C. M. bovis BCG (◊) and BCG ΔnudC ( ) with no drug added; M. bovis BCG (⋄) and BCG ΔnudC (★) with 50 µg ml−1 ETH added. Experiments were performed in triplicate. Standard deviations are indicated by error bars.
