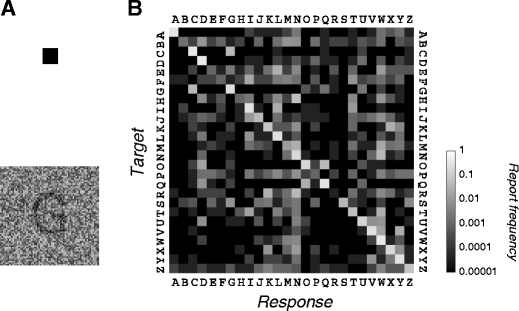
Fig. 3.

Similarity. a The observer fixated a small black square at the center of the screen. A dark uppercase letter of size (height) 0.9º was presented for 150 ms. It was centered on the vertical meridian in the lower visual field at an eccentricity of 10º (A.W., J.F.) or 8º (R.C.). Independent noise drawn from a zero-mean uniform distribution was added to each pixel of a 2.25º × 2.25º square region containing the letter. In the experiment, the background was gray (42 cd/m2), matched to the mean luminance of the region containing the letter, but in this illustration, the background is white. The task was to identify the target letter. The noise level (range of the uniform distribution from which the noise is drawn) was adjusted to roughly match accuracy across observers (41% ± 5% frequency of correct responses, average ± standard error across 3 observers; chance performance was 4%). While fixating the black square, one would find it hard to tell the letter. It could be a G, a C, a Q, or an O. After being displayed for 150 ms, the target and fixation square disappeared, and after a 200-ms delay, a response screen showed all 26 letters as possible responses. The observer moved the mouse-controlled cursor to select a response, after which the response screen disappeared. The feedback tone was high-pitched for correct and low-pitched for incorrect. After another 200-ms delay, the fixation square reappeared, and after 1 s, the next letter appeared. In a single session, each letter was presented 20 times, for a total of 520 trials. Observers did four separate sessions, for a total of 80 trials per letter. b We measured a confusion matrix for each observer. The confusion matrix for observer J.F. is shown on the right. Each row of the matrix corresponds to a different target letter (A–Z). The gray level of each cell indicates the fraction of trials on which the target was reported as a particular letter (A–Z)
