
Figure 3.
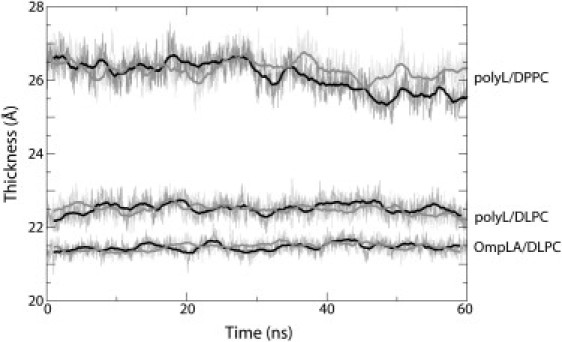
Membrane hydrophobic thickness over the course of the Ala → Arg FEP simulations. Thickness was measured as the separation between the average positions of the carbonyl carbon atoms in the lipid tails of each leaflet (denoted C21 and C31 in the force field); this thickness is nearly identical to the experimental value for DLPC, namely 2zCG = 21.8 Å (37). The black and gray curves represent the forward and reverse trajectories for each protein-membrane combination indicated in the plot.