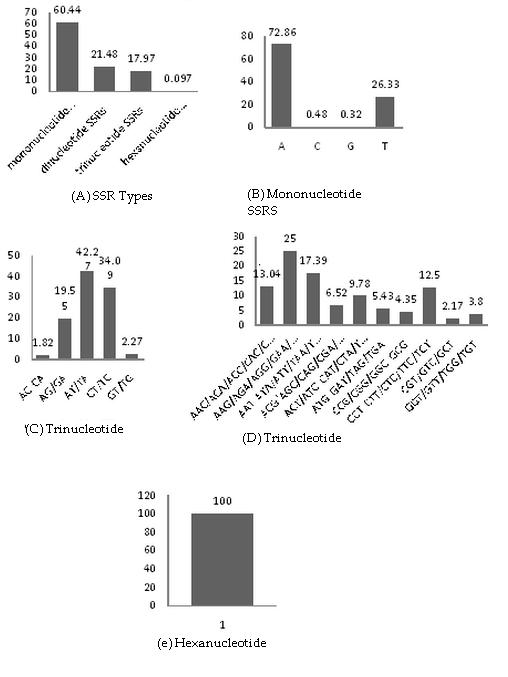
Figure 1.

(A) Percentage distribution of different SSRs; (B) Percentage distribution of mononucleotide SSRs; (C) Percentage distribution of drinucleotide; (D) Percentage distribution of rinucleotide SSRs; (E) Percentage distribution of hexanucleotide SSRs
