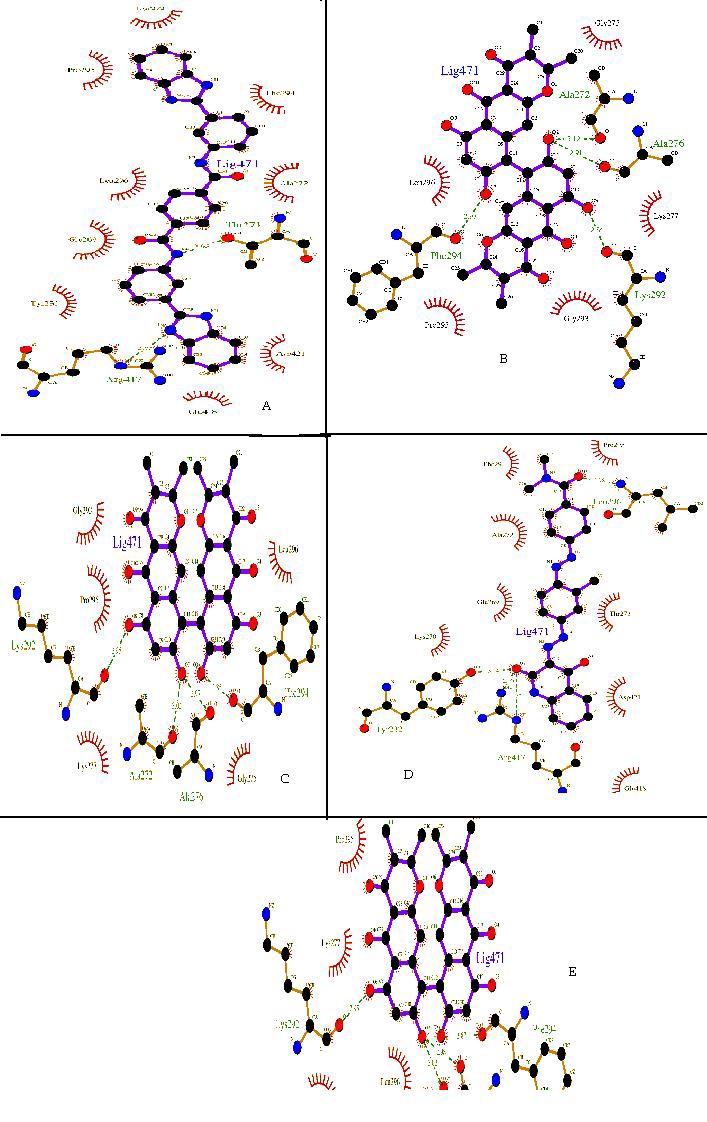
Figure 3.

Ligplot showing the protein-ligand interactions of top five ligands, based on energy score (hydrogen bonding and hydrophobic), generated by Ligplot program. (A) ZINC01690699; (B) ZINC17465979; (C) ZINC17465983; (D) ZINC18141294_03 and (E) ZINC05462670.
