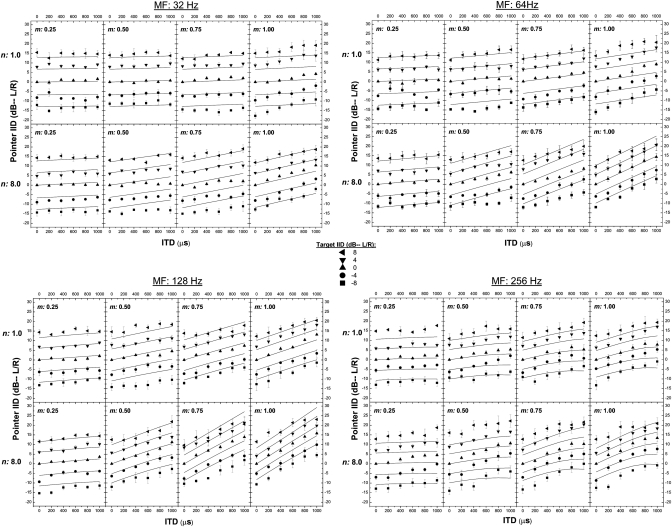
Figure 1.
The four quadrants of the figure display data obtained when the frequency of modulation was 32, 64, 128, and 256 Hz, respectively. The panels along the top and bottoms rows of each quadrant display data obtained when the exponent of the raised sine, n, was 1.0 and 8.0, respectively. Panels within the columns of each quadrant contain data obtained for depths of modulation, m, of 0.25, 0.50, 0.75, and 1.00, respectively. Each panel displays the IID of the pointer (in dB) required to match the intracranial position of the target as a function of the ongoing ITD (left ear leading) imposed on a 200-Hz-wide band of Gaussian noise centered at 500 Hz. Symbols represent the mean values computed across the three listeners. The error bars represent ±1 standard error of the mean. The parameter within each plot is the IID of the target. As discussed in the text, the data plotted for conditions in which the target-IID was zero for rates of modulation of 32, 128, and 256 Hz were obtained in an earlier study (Bernstein and Trahiotis, 2011b) from the same listeners who provided the rest of the data. The lines represent predictions from the position-variable model (see text).

