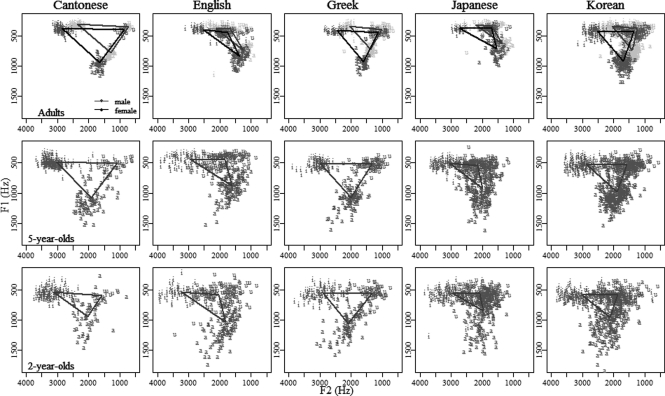
Figure 2.
Scatter plots of F1 and F2 by language and age for both males (grey) and females (black). Each point represents the production of a single vowel by a single speaker. The vowel space was drawn by connecting the mean F1–F2 value of all productions of each vowel for each language and age group.

