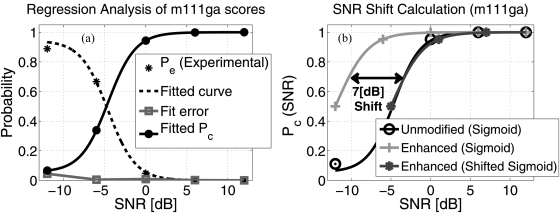
Figure 11.
(Color online) The gathered data is fit to sigmoids (Eq. B1) for estimating the lateral shift in SNR of the curves after modification. (a) To do this, the Pe = 1 − Pc values at the 5 SNRs is fit to a sigmoid. (b) Each sigmoid of the modified sounds is shifted along the x-axis until the mean squared difference between ordinates of the curves of the unmodified and modified sound is minimized. This resulting shift is taken to be the SNR shift after modification. In the given example, the minimum error occurs for a 7.0 [dB] shift.

