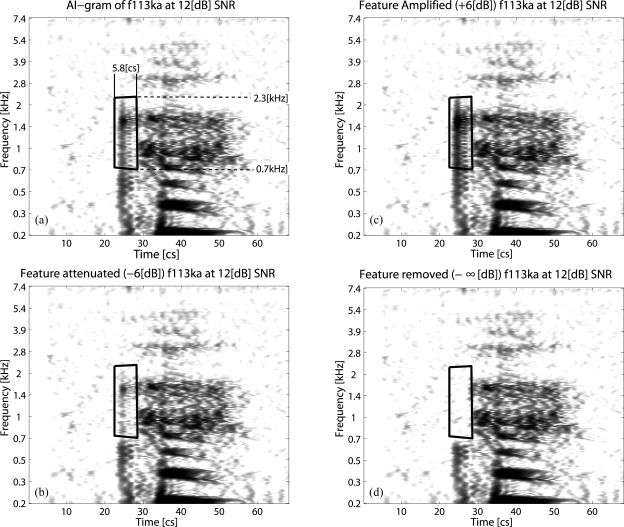
Figure 3.
AIgrams of the four conditions used: (a) The AIgram of the unmodified f113ka, showing the feature region, listed in Table TABLE I.. (c) The AIgram of the feature-amplified (+6 [dB]) version of f113ka. (b) The AIgram of the feature-attenuated (–6 [dB]) version of f113ka. (d) The AIgram of the feature-removed (–∞ [dB]) version of f113ka. A marked change in the relative energy of the feature is easily visible, after these modifications.

