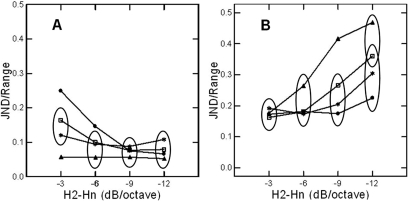
Figure 2.
Variations in sensitivity to changes in NHR and H2–Hn as a function of baseline H2–Hn. The y axis shows the ratio of the JND to range for the NHR (an index of listeners’ overall sensitivity), and the x axis shows baseline H2–Hn. (a) Sensitivity to changes in NHR. (b) Sensitivity to changes in H2–Hn. Values for NHR = −40 dB (noise free) are plotted with filled circles; open squares represent values when the NHR = −30 dB; asterisks show values when the NHR = −20 dB; and filled triangles indicate values when the NHR = −10 dB (very noisy). Ellipses enclose points that do not differ significantly. See text for fuller description.

