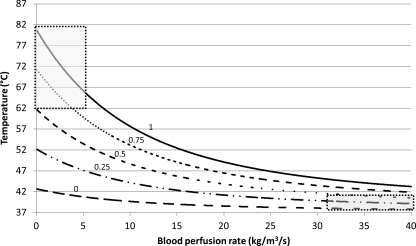
Figure 10.
Temperature increase at different interaction times. Each curve represents temperature change at different blood perfusion rates. The numbers above each curve represent the fraction of sonication time the microbubbles are present in the ultrasound beam. The heating pattern in tumor vessels will correspond to the upper left part of the curve (upper left box), while the normal blood vessels with faster blood flow will follow the heating pattern on the right side of the lowest curve (lower right box).

