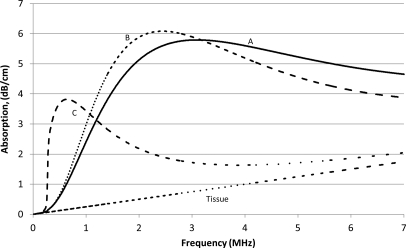
Figure 3.
Absorption vs frequency curves for biological tissues with microbubbles A, B, and C and tissue alone. The calculations were performed for the microbubble concentration of 10−5 ml of microbubbles/ml of tissue. Note that the absorption of the microbubble ensembles is greater than that of tissues alone, and that the differences between the absorption of the three ensembles are frequency dependent.

