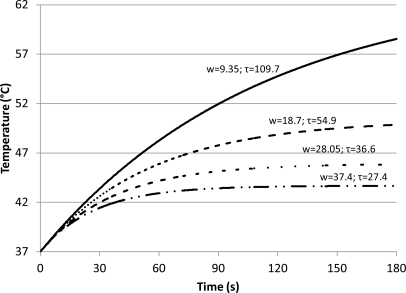
Figure 9.
Temperature increase at different blood perfusion rates in the presence of microbubble distribution A (Table TABLE I.) at a concentration of 10−5 ml microbubbles/ml tissue. The calculations were performed for ultrasound intensity and frequency of 2.2 W/cm2 and 3 MHz, respectively; the numbers above the curves represent blood flow in units of kg/s/m3. As flow rate increases there is a corresponding decrease in tissue temperature.

