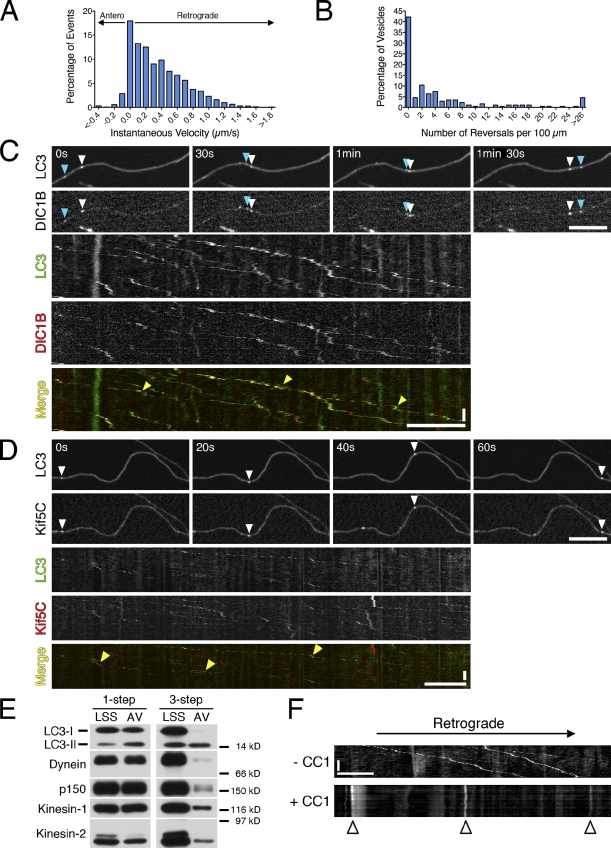
Figure 2.
Autophagosome dynamics in primary neurons are driven primarily by cytoplasmic dynein. (A) Individual GFP-LC3 puncta along the axon were tracked to yield a histogram of instantaneous velocities (n = 8,872 events). Shown are pooled data for 173 vesicles from 59 neurons from 12 mice analyzed in 12 separate experiments. (B) Reversals within 100 µm for each vesicle (median is 1.6 reversals/100 µm, n = 173 vesicles analyzed as in A). Median reversal length is 0.3 µm. (C) Time series and corresponding kymograph of GFP-LC3 and DIC1B-mCherry motility along the axon (Video 4). Open and cyan arrowheads denote two different examples of vesicles positive for both markers. Yellow arrowheads in the kymograph denote multiple examples of vesicles positive for both markers. The red signal may occasionally precede the green signal because of delays in acquiring consecutive images. (D) Time series and corresponding kymograph of GFP-LC3 and mCherry-Kif5C tail motility along the axon. Open arrowhead denotes a vesicle positive for both markers. Yellow arrowheads in the kymograph denote multiple examples of vesicles positive for both markers. (E) Fractions enriched for autophagosomes were prepared using a one-step gradient (Morvan et al., 2009) or a three-step gradient (Strømhaug et al., 1998) that more effectively selects for the lipidated form of LC3, LC3-II. Equal total protein from the low speed supernatant (LSS) and autophagosome-enriched fraction (AVs) were analyzed by immunoblotting. Autophagosome membrane-associated LC3-II is distinguished from cytosolic LC3-I by molecular mass (shown is endogenous LC3). Motors may not be quantitatively retained on autophagosome membranes through the three-step gradient. (F) Kymograph of GFP-LC3 motility from DRG neurons transfected with the dominant-negative CC1, which disrupts dynein/dynactin function. Arrested autophagosomes are marked with arrowheads. Horizontal bars, 10 µm. Vertical bars, 1 min.

