Figure 3.
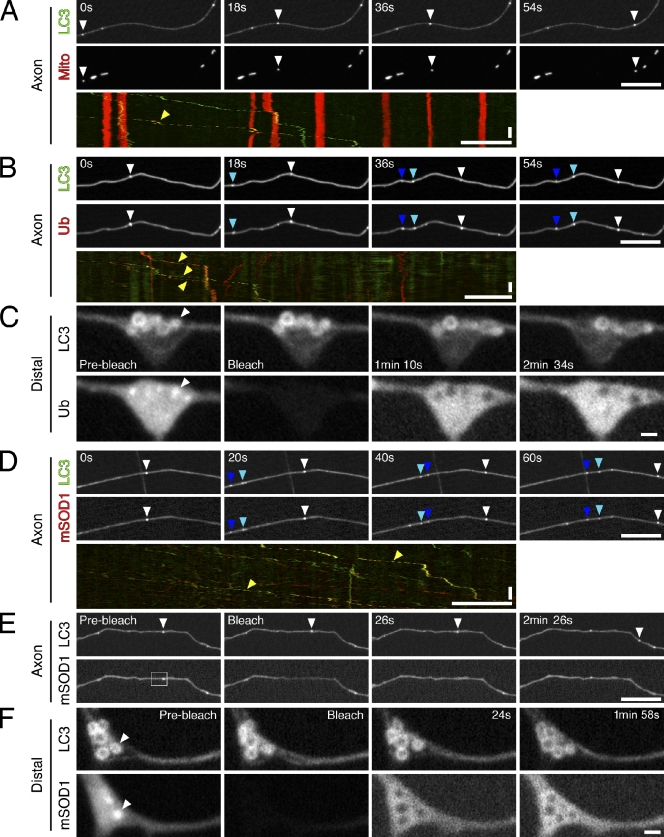
Autophagosomes contain engulfed cargo. (A) Time series and corresponding kymograph of GFP-LC3 and DsRed2-mito motility along the axon. Open arrowheads in times series and yellow arrowhead in kymograph denote a vesicle positive for both markers. (B) Time-lapse images and corresponding kymograph of GFP-LC3 and RFP-Ub motility along the axon. Open, cyan, and dark blue arrowheads denote three different examples of vesicles positive for both markers. Yellow arrowheads in kymograph denote multiple examples of vesicles positive for both markers. (C) FRAP analysis of RFP-Ub fluorescence inside autophagosome rings at the distal end of the neurite. Arrowheads denote enrichment of RFP-Ub inside autophagosome ring. (D) Time series and corresponding kymograph of GFP-LC3 and mCherry-SOD1G93A motility along the axon. Open, cyan, and dark blue arrowheads denote three different examples of vesicles positive for both markers. Yellow arrowheads in kymograph denote two different examples of vesicles positive for both markers. (E) FRAP analysis of mCherry-SOD1G93A fluorescence inside an autophagosome along the axon. Box denotes photobleached region, and arrowheads denote bleached vesicle. (F) FRAP analysis of mCherry-SOD1G93A fluorescence inside autophagosomes at the neurite tip. Arrowheads denote enrichment of mCherry-SOD1G93A inside the autophagosome ring. For distal FRAP images, the contrast enhancement applied to prebleach and bleach images was different from that applied to recovery images. Horizontal bars: (axon images) 10 µm; (distal images) 1 µm. Vertical bars, 1 min.

