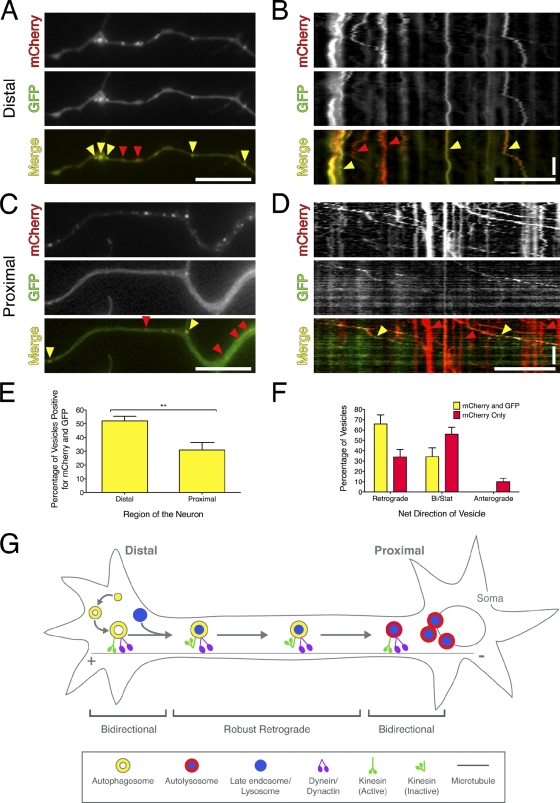
Figure 5.
Autophagosomes mature as they move distally to proximally along the axon. (A) Wild-type neurons transfected with mCherry-EGFP-LC3. In acidic environments, the GFP moiety is preferentially quenched, and only the red fluorescence persists (yellow arrowheads show LC3 puncta positive for mCherry and EGFP; red arrowheads show LC3 puncta positive for mCherry only). (B) Corresponding kymograph of mCherry-EGFP-LC3 motility at the distal tip. (C and D) Images from live-cell analysis and corresponding kymographs from regions proximal to the cell soma. (E) Quantitation of LC3 puncta positive for mCherry and GFP in the distal versus proximal regions of the axon (means ± SEM; n = 9 neurites; **, P = 0.0043, t test). (F) Percentage of retrograde, anterograde, or bidirectional/stationary vesicles (means ± SEM; n = 9 neurites). (G) Model for autophagosome biogenesis and maturation along the axon in primary neurons. Horizontal bars, 10 µm. Vertical bars, 1 min.

