Figure 1.
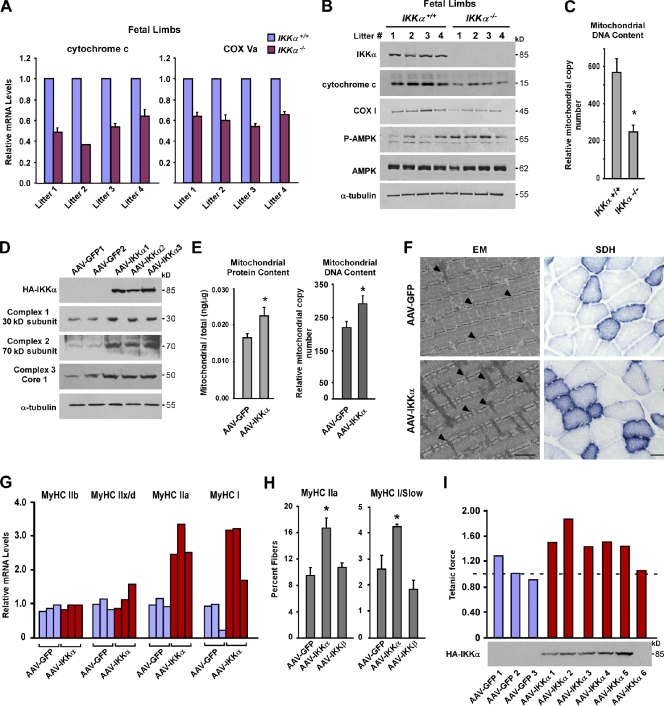
IKKα regulates mitochondrial biogenesis and fiber type specification in vivo. (A) Hind limbs from four independent litters of IKKα+/+ and IKKα−/− embryos (total n = 8) were isolated at E20. Cytochrome c and COX Va were measured by real-time quantitative RT-PCR. (B) Additional tissues from E20 limbs from A were homogenized and probed by Western blotting. (C) Total DNA was extracted from E20 limbs, and real-time RT-PCR analysis was performed to quantitate mitochondrial and nuclear (GAPDH) genome copy number. Results are means of five mice per genotype and calculated as fold mitochondrial over genomic DNA. P = 0.004. (D) AAV-GFP and AAV-IKKα viruses were injected into the TA. Mice were sacrificed after 3–4 mo, and protein lysates were prepared and analyzed by Western blotting. Shown is a representative blot from five independent experiments. (E and F) After similar viral injections as described in D, mitochondria were fractionated, and protein concentrations or DNA content was determined and normalized to total protein/DNA content (E; n = 5 per group; P < 0.005) or TA muscles were analyzed by EM (F). Bar, 1 µm. Parallel muscles were stained for SDH. Bar, 200 µm. Arrowheads point to individual mitochondria. (G) TA muscles were isolated from AAV-GFP– and AAV-IKKα–injected mice (n = 3 per group, repeated five times), and myosin isoforms were measured by real-time RT-PCR. The data shown are from a single representative experiment out of three replicates. (H) Sections from AAV-GFP– and AAV-IKKα–injected mice (n = 4) were immunostained with MyHC IIa and I forms, and positive fibers were expressed as a percentage of total fibers in each section (n = 3 sections per muscle per mouse). (I) EDL muscles were isolated from AAV-GFP (n = 3)– or AAV-IKKα (n = 6)–injected mice, and force measurements were made after isometric contractions. Values are expressed as a ratio of the force generated over values from uninjected contralateral muscles. The dotted line shows levels of 1. Values shown are from a single experiment. Asterisks denote significance. Error bars are means ± SEM. P, phospho; AMPK, AMP-activated protein kinase.

