Figure 1.
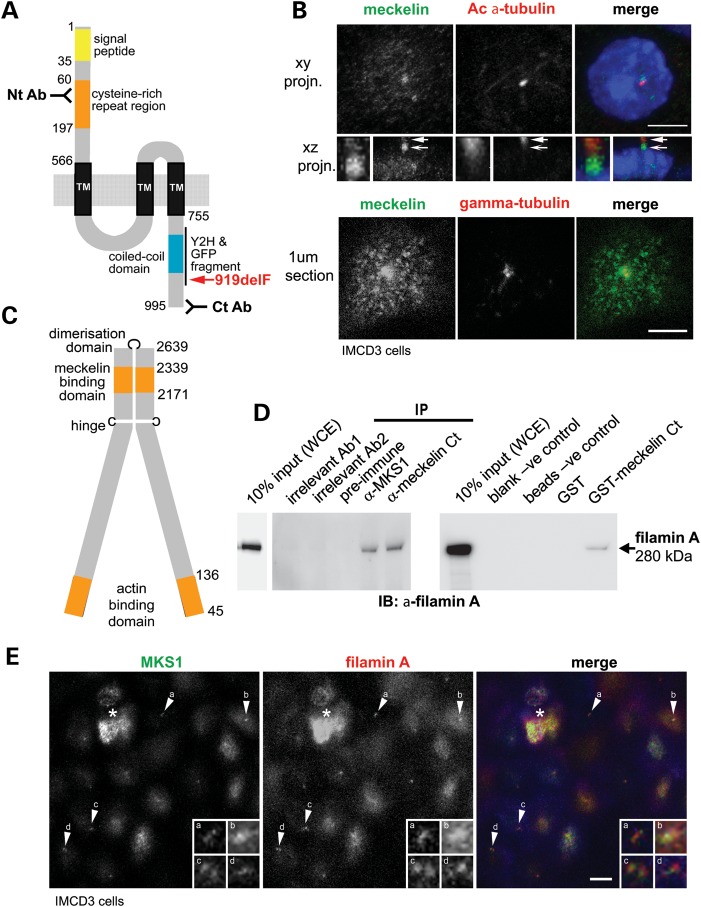
Meckelin localizes to the primary cilium and basal body and interacts with filamin. (A) Domain structure of meckelin showing the locations of predicted signal peptide, cysteine-rich repeat region, a region containing potential three to seven transmembrane domains (TM) and a coiled-coil domain. Indicated are the locations of epitopes for two anti-meckelin antibodies (‘Nt Ab’ and ‘Ct Ab’), the C-terminal region used for a Y2H bait fragment and a meckelin Ct-GFP construct, and the pathogenic MKS in-frame deletion mutation p.919delF (red). Numbering indicates the amino-acid residue. (B) Upper panels: Co-immunostaining and confocal microscopy of a ciliated mouse IMCD3 epithelial cell for meckelin (using the Nt Ab; green in merged image) and acetylated (Ac)-α-tubulin antibody (red) showing co-localization of meckelin isoforms at the cilium. A confocal x–y projection (planar projn.) and x–z-side projection are shown. Enlarged insets (white frames) show detail of localization at the proximal region of the cilium (arrow) and the basal body (barbed arrow). Nuclear localization of 4′,6-diamidino-2-phenylindole (DAPI) is shown in blue. Scale bar, 5 µm. Lower panels: 1 μm confocal section of the apical cell surface following co-immunostaining for meckelin Ct (green) and γ-tubulin (red). At the apical surface, meckelin had a punctate distribution and strong peribasal body accumulation. Scale bar, 5 µm. (C) Domain structure of filamin A showing meckelin-binding domain, actin-binding domain, dimerization domain and hinge. Numbering indicates the amino-acid residue. (D) Left panel: IP of endogenous filamin A (size 280 kDa) from confluent HEK293 WCE with anti-meckelin Ct (‘Ct Ab’) and anti-MKS1 but not by pre-immune serum-negative control or two irrelevant antibodies (Ab1 and Ab2). Right panel: pull-down of filamin A from WCE by GST-tagged meckelin Ct but not by GST alone, or blank and beads only negative (−ve) controls. Western immunoblotting (IB) was with an anti-filamin A MAb. Ten percent of total input WCE is indicated. (E) Co-immunostaining and confocal microscopy of a ciliated mouse IMCD3 epithelial cell for MKS1 (a basal body marker; green in merged image) and filamin A (red) showing localization of filamin A to the basal body and apical cell surface. A 2 μm apical section is shown. Enlarged insets (white frames, labelled a–d) show detail of localization at the basal body (arrows a–d). Scale bar, 5 µm. The asterisk indicates a cell above the monolayer.

