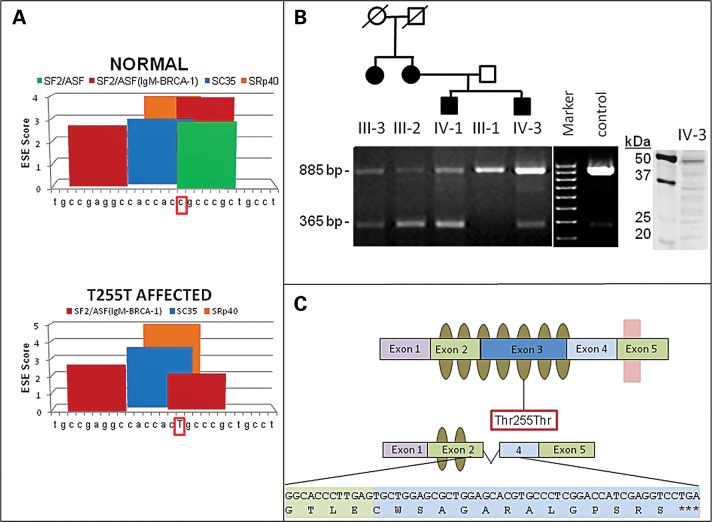
Figure 2.
Predicted model of ASB10 alternative splicing, ESE sites and splicing in transformed lymphocytes from POAG patients and controls. (A) Graphical representation of in silico ESE finder analysis. Using the normal ASB10 sequence surrounding the synonymous Thr255Thr change, a number of different splice enhancer binding sites are predicted. When the synonymous change (c.765C>T) (surrounded by red box) is introduced, the splice enhancer SF2/ASF site is lost (green bar, lower panel) and the scores of other ESEs are altered. The nucleotides that were analyzed with ESE finder correspond to nucleotides 860–886 of ASB10 cDNA (NM_080871.3). (B) RT-PCR on transformed lymphocyte RNA from four affected GLC1F family members, the unaffected father of two of them and an unrelated control (Cnt) using primers located in exons 2 and 4 of ASB10. In all individuals, a PCR product of 885 bp (exons 2–4) is present, whereas an additional product of 365 bp (exons 2–4) is detected in affected individuals. The identity of the affected individuals and their position in the pedigree is indicated above the graph. This pedigree is a partial pedigree of the family shown in Figure 1. The agarose gel is representative of several different replicates performed. Western blot analysis of ASB10 protein from lymphoblasts from individual IV-3 is shown. A full-length band (48 kDa) and several smaller-molecular-weight bands are detected using the monoclonal V1 antibody. Molecular weight markers (kDa) are shown. (C) Schematic of the ASB10 protein. Ankyrin repeats are indicated by olive ovals. The SOCS box is indicated by a pink box overlapping exon 5. The position of the synonymous change (Thr255Thr) is indicated by a red box. The predicted coding sequence and protein structure when exon 3 is spliced out is also shown. This leads to a premature stop codon with the loss of five ankyrin repeats and the SOCS box.

